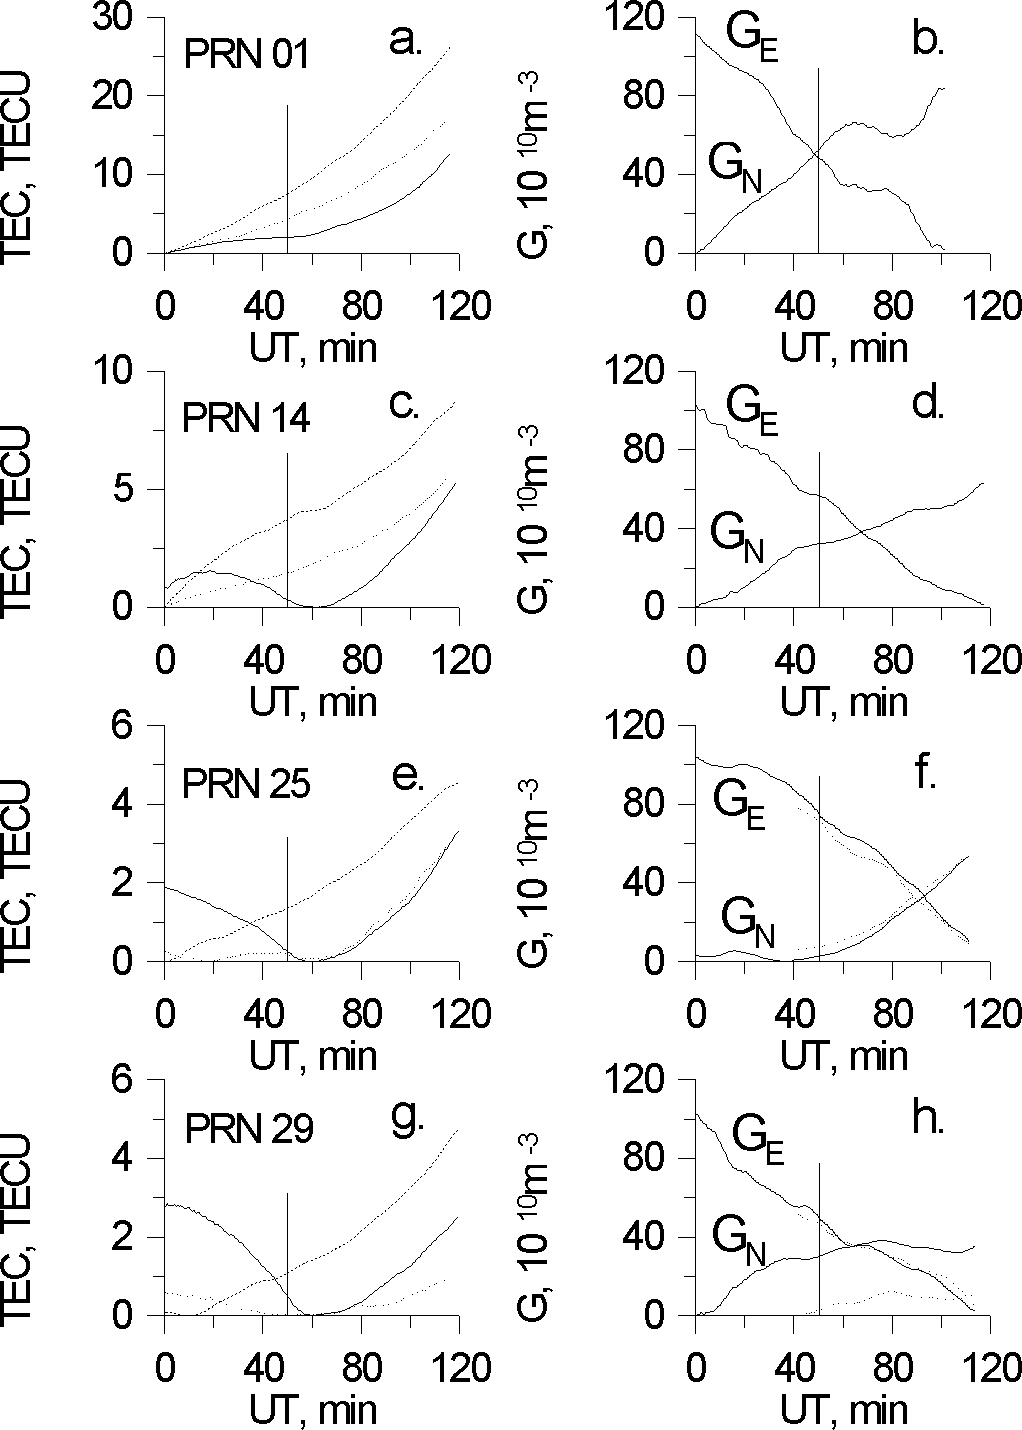
Figure 3.
Variations of TEC (a, c, e, g) and gradients (b,
d, f, h) as obtained for PRN01 (a, b), PRN14 (c, d), PRN25 (e, f), and PRN29 (g,
h) for March 8 (dots), 9 (heavy line), and 10 (dashed line), 1997. Vertical bars
mark the time of the maximum phase at 300 km altitude for these
satellites.