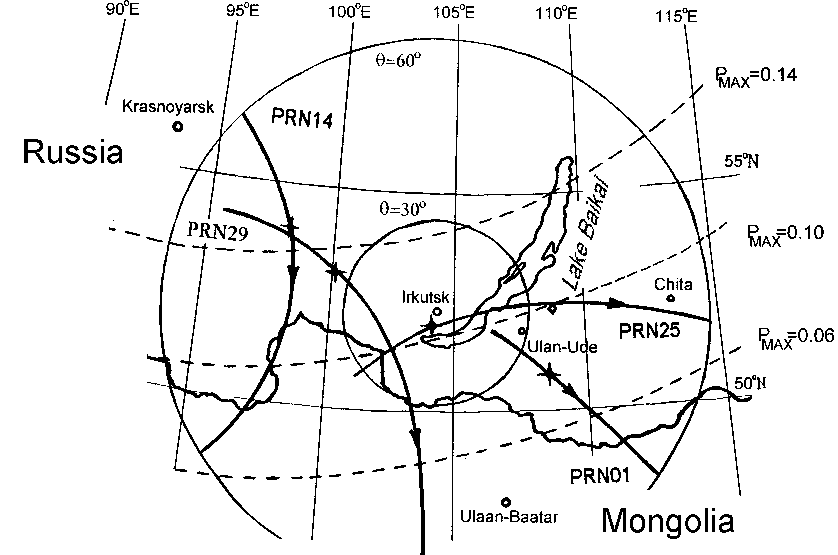
Figure 1.
Schematic map of the southern part of East
Siberia where our observations were carried out. Dashed lines are the lines of
equal maximum phase Pmax of eclipse at H=300 km, corresponding to the
phases: 0.14, 0.10, and 0.06. Circles enclose areas of subionospheric points at
H=300 km for selected satellites visible from Irkutsk in the range of zenith
angles from 0° to 30° and
60°. Trajectories of subionopsheric points for 300 km
altitudes are shown for each satellite with arrows that show their directions,
and asterisks label the location of subionospheric points at the time of the
maximum phase of eclipse.
